Introduction
The models described here represent the state of the art in solar model construction circa 2010. Both models were computed using the latest version of the Yale Stellar Evolution Code (yrec7d).
Description
The OPAL 2005 opacity tables were used throughout most of the model,
except at lower temperatures where Furgeson 2005 opacities were used. Both sets of opacity tables are provided with Z interpolation
routines so that as Z changes due to nuclear burring and diffusion the appropriate Z is used.
The effects of helium diffusion and helium and heavy element diffusion are
included. The diffusion formulation is identical to that described in (Bahcall
and Pinsonneault 1995). We note that the heavy element diffusion coefficients
and equations are for iron alone. The other elements are assumed, for this
calculation, to diffuse at similar rates, that is we assume the iron diffusion
rate scaled to the total Z mass abundance is the total Z diffusion rate.
This is certainly not correct but at this time we cannot carry out more
sophisticated calculations.
The model was evolved from a zero age main sequence (ZAMS) model to near
the age of the Sun, 4.55-Gyr (Guenther 1989) in ~740 time steps.
By adjusting the helium abundance and mixing length parameter of each model,
the models were tuned to match the Sun's radius, (here taken to be) Rsun
= 6.9598E10 cm and the Sun's luminosity, Lsun=3.8515E33 erg/s to one
part in 1.0E5. The final surface Z/X abundance was also tuned to 0.0244.
Two different atmosphere models were used: the Krishna Swamy (1966) T-tau relation and the Eddington gray atmosphere. The former applies only to the Sun and provides a more accurate representation of the Sun's atmosphere than the Eddington grey atmosphere. The latter, though, is the standard atmosphere model used for all other stellar models.
Detailed Model Listing
The following files (linked to below) contain complete listings of
all the physical variables of the solar models as a function of radius. Data
from every shell is listed. The file lists: luminosity, temperature,
density, pressure, specific heat at constant volume, specific heat at constant
pressure, the adiabatic exponent Gamma_1, mean molecular weight, sound speed,
nuclear reaction rate, X, Z, opacity, derivative of opacity w.r.t. log density,
derivative of opacity w.r.t. log temperature, temperature gradient, adiabatic
temperature gradient, derivative of log pressure w.r.t. log density, derivative
of log pressure w.r.t. log temperature, derivative of log energy generation
rate w.r.t. log density, derivative of log energy generation rate w.r.t.
log temperature, Lamb frequency squared, Brunt Viäsälä frequency
squared, critical frequency plus squared, critical frequency minus squared,
(remaining parameters not defined in this model).
Standard Solar Model with Grey Atmosphere 2010 (c) 2010 D. B. Guenther
Standard Solar Model with Krishna-Swamy Atmosphere 2010 (c) 2010 D. B. Guenther
Comparison of Model Low l P-modes to Sun
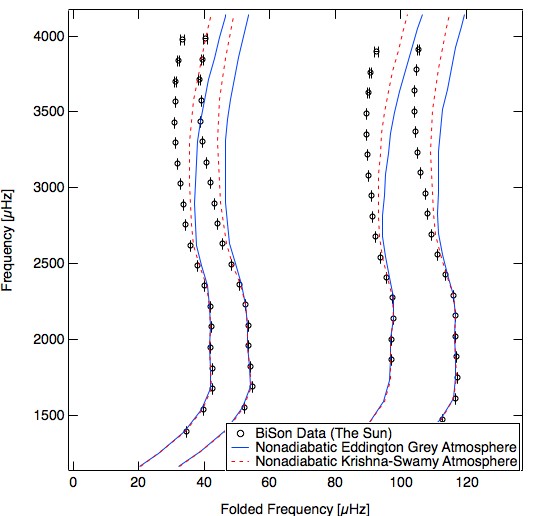
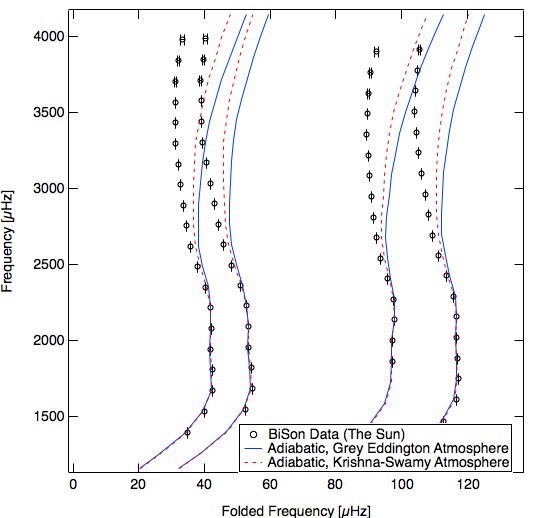
The following two plots compare the Sun's oscillation spectrum to the oscillation spectrum obtained from the two models. The standard echelle diagram plots folded frequency versus frequency for the Sun, small circles (the frequency uncertainty is smaller than the plot symbol, show for the x-axis scale only), the Eddington grey atmosphere model, solid blue line, and the Krishna-Swamy atmosphere model, dashed red line. The first plot compares adiabatic model frequencies to the Sun and the second plot compares nonadiabatic model frequencies to the Sun.
The observed p-mode frequencies are from the Birmingham Solar Oscillations Network. The model p-modes were computed using Guenther's nonradial, nonadiabatic pulsation code.
The discrepancy (systematic) at high frequencies (~0.3%) is real and represents a true error in the standard solar model. It is in part due to the inadequacies of the mixing length approximation used to model the temperature structure in the Sun's outer convective envelope, specifically the superadiabatic layer located just below the surface and in part due to neglecting the turbulent pressure in the nonadiabatic p-mode calculation.
Sun versus Adiabatic p-modes
Sun versus Nonadiabatic p-modes